Why Don't All Vegetables Cool the Same? A Look at Cooling Curves
Ever noticed how leafy lettuce seems to chill in a flash in a vacuum cooler, while denser items like broccoli might take a little longer to reach that perfect core temperature? It’s not your imagination – different vegetables have unique "cooling curves."
A vegetable’s cooling curve illustrates how its temperature drops over time during the cooling process. This curve is influenced by the product’s physical characteristics like surface area-to-volume ratio, moisture content, density, and tissue structure, meaning each type of vegetable cools at a distinct rate and pattern.
Understanding these differences is crucial, not just for us as equipment manufacturers, but for you as a grower or processor. It helps optimize cooling cycles, ensure product quality, and maximize efficiency. Let’s explore why these curves vary and what they tell us.
What Factors Make a Vegetable’s Cooling Curve Unique?
If you put a head of iceberg lettuce and a dense sweet potato into a cooler, you wouldn’t expect them to cool at the same speed, would you? Several inherent properties of the vegetable itself dictate how quickly and efficiently it can shed heat.
Key factors influencing a vegetable’s cooling curve include its surface area-to-volume ratio, initial moisture content, density, and the thermal conductivity of its tissues. Products with more surface area and higher moisture generally cool faster with methods like vacuum cooling.
I’ve seen this play out countless times. For example, when working with a client like Carlos who grows a variety of crops, we often discuss how the settings for his vacuum cooler need slight adjustments depending on whether he’s cooling spinach or, say, corn on the cob.
Let’s break down these primary factors:
- Surface Area-to-Volume Ratio1: This is a big one, especially for vacuum cooling. Products with a large surface area relative to their total volume (like leafy greens – lettuce, spinach) have more area for water to evaporate from. Since evaporative cooling is a surface phenomenon, these products cool very rapidly. Denser, more spherical products (like potatoes or beets) have less surface area per unit of mass, so heat from their core takes longer to reach the surface and be removed.
- Moisture Content and Availability2: Vacuum cooling relies on the evaporation of water. Vegetables with high free moisture content on their surfaces or loosely bound water within their tissues will cool more quickly because this water can readily vaporize. Celery, with its high water content, cools well. Drier products, or those where moisture is tightly bound, might cool slower or benefit from pre-wetting.
- Density and Tissue Structure: Denser vegetables with tightly packed cells (like carrots or sweet potatoes) conduct heat from their core to their surface more slowly. Porous products (like mushrooms) or those with many air spaces (like broccoli florets) might allow for more rapid internal temperature changes or more surface area for evaporation.
- Initial Temperature: Obviously, a vegetable starting at 30°C will take longer to cool to 2°C than one starting at 20°C, assuming all other factors are equal. The cooling curve tracks this drop.
- Respiration Rate3: Living vegetables continue to respire after harvest, generating a small amount of heat. Products with very high respiration rates (like asparagus or sweet corn) generate more heat, which slightly counteracts the cooling process. Rapid cooling is essential to slow this respiration down quickly.
Here’s a general idea of how these factors might play out:
| Vegetable Type | Surface Area/Volume | Moisture Content | Density | Typical Vacuum Cooling Speed |
|---|---|---|---|---|
| Leafy Greens (Lettuce, Spinach) | High | High | Low | Very Fast |
| Cruciferous (Broccoli, Cauliflower) | Moderate-High (florets) | Moderate-High | Moderate | Fast |
| Fungi (Mushrooms) | Moderate | High | Low-Moderate | Fast |
| Stalks (Celery) | Moderate | Very High | Moderate | Fast |
| Fruiting Veg (Sweet Corn) | Moderate (kernels) | High | Moderate | Moderate-Fast |
| Root Vegetables (Carrots – if suitable) | Low | Moderate | High | Slower / Less Suitable |
It’s clear that a "one-size-fits-all" approach to cooling doesn’t work.
How Do Cooling Curves Look for Different Vegetable Categories?
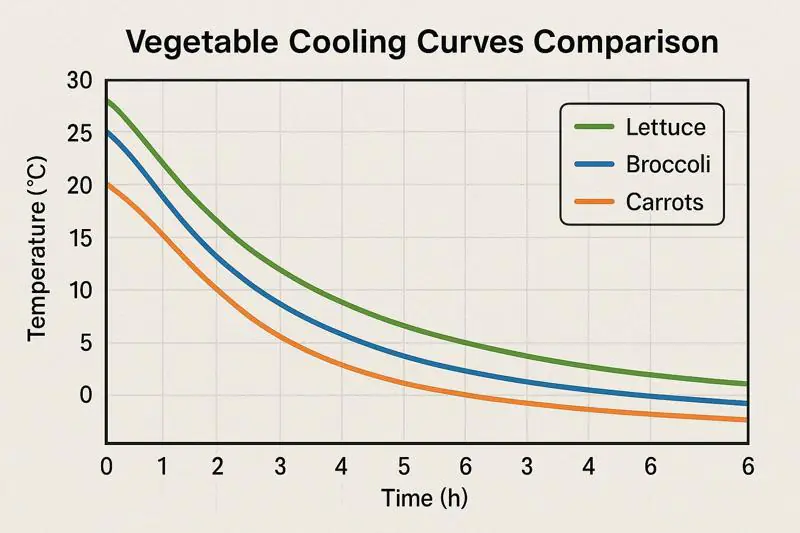
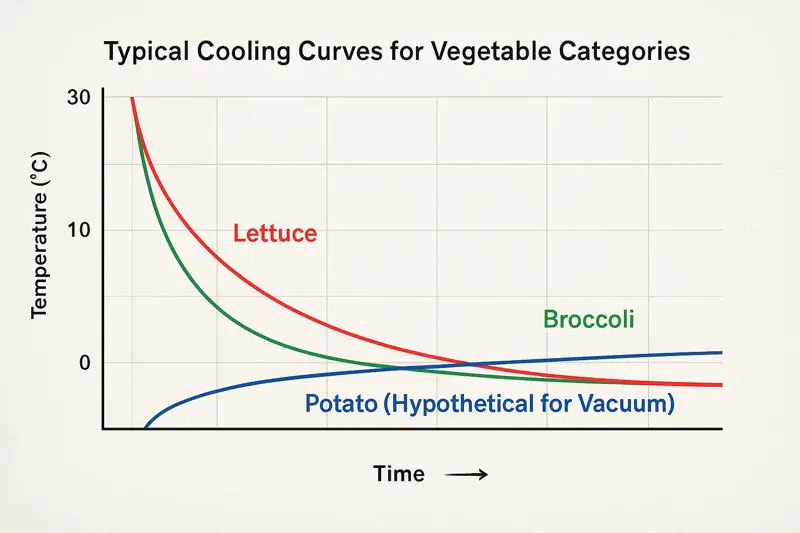
Let’s visualize how these factors translate into actual cooling performance. While exact curves depend on the specific cooler and conditions, we can discuss general patterns for common vegetable types when using vacuum cooling.
Leafy greens typically show a very steep initial drop in temperature, cooling rapidly. Broccoli and cauliflower also cool efficiently. Mushrooms, with their high moisture, respond well. Denser items or those with less free moisture will have a more gradual cooling curve.
When we commission a new allcold vacuum cooler for a client, like for Sophia’s central kitchen which handles various cooked items (though the principle applies to fresh too), we often run tests with their specific products to dial in the optimal cycle times. This involves tracking these curves.
Typical Cooling Curve Characteristics:
- Leafy Greens (e.g., Lettuce, Spinach, Bok Choy):
- Curve Shape: Very sharp, almost vertical initial drop, then quickly flattens out as it approaches the target temperature.
- Reasoning: High surface area-to-volume ratio4, high free moisture. Water evaporates easily from all leaf surfaces.
- Time Example: From 25°C to 2°C might take only 15-20 minutes.
- [Placeholder for individual leafy green cooling curve chart]
- Floreted Vegetables (e.g., Broccoli, Cauliflower):
- Curve Shape: Steep initial drop, but perhaps slightly less abrupt than leafy greens. The complex structure provides good surface area.
- Reasoning: Good surface area from florets, good moisture. The denser stalks might cool a fraction slower than the very tips of the florets, but overall cooling is efficient.
- Time Example: From 25°C to 2°C might take 20-30 minutes.
- [Placeholder for individual broccoli cooling curve chart]
- Mushrooms:
- Curve Shape: Rapid cooling, similar to leafy greens in speed.
- Reasoning: High moisture content5 (often >90%), porous structure allows easy moisture release.
- Time Example: Can cool from 20°C to 2°C in around 15-25 minutes.
- [Placeholder for individual mushroom cooling curve chart]
- Sweet Corn (on the cob):
- Curve Shape: Moderately fast cooling. Kernels cool well, but the cob itself is denser.
- Reasoning: Kernels have good moisture. Heat removal from the central cob takes a bit longer. High respiration also means it’s generating some heat.
- Time Example: May take 25-35 minutes depending on size and initial temperature.
- [Placeholder for individual sweet corn cooling curve chart]
- Products Less Suited or Slower with Standard Vacuum Cooling (e.g., Carrots, Potatoes, Apples):
- Curve Shape: Much more gradual, flatter curve.
- Reasoning: Low surface area-to-volume ratio6, dense structure, moisture less readily available for rapid evaporation. Heat transfer from the core is slow. While some cooling occurs, it’s not as dramatic or efficient as with leafy/porous items. (Note: Specialized hydro-vacuum or wet-vacuum techniques can improve performance for some of these.)
- Time Example: Might take significantly longer, or not reach core temps effectively without modification.
These are generalizations, and specific cultivars, sizes, and even how they are packed can influence the curves.
How Can We Use Cooling Curve Data to Improve Our Operations?
Understanding these cooling curves isn’t just an academic exercise. This knowledge is highly practical and can directly impact your efficiency, product quality, and profitability, something a discerning buyer like Norman would appreciate in his suppliers.
By analyzing cooling curves, operators can optimize vacuum cooler cycle times for specific vegetables, ensure consistent core cooling to extend shelf life, prevent over-cooling or under-cooling, and potentially improve energy efficiency by not running cycles longer than necessary.
This is where the "art and science" of post-harvest handling meet. Here’s how this data translates to better practices:
- Optimizing Cycle Times7: If you know that your specific variety of spinach reliably cools to the target 2°C in 18 minutes, you don’t need to run the cycle for 25 minutes. This saves time, increases throughput, and reduces energy consumption per cycle.
- Ensuring Product Quality & Shelf Life8: Under-cooling, where the core of the product doesn’t reach the target temperature, means higher respiration rates continue, and microbial growth isn’t sufficiently slowed. This shortens shelf life. Cooling curves, especially when validated with core temperature probes, confirm that the entire batch is adequately cooled.
- Preventing Damage: For some sensitive products, over-cooling or cooling too rapidly could theoretically cause issues (though less common with vacuum cooling than with, say, direct icing if not done right). Knowing the curve helps set appropriate endpoints.
- Batch Consistency: If you’re cooling mixed loads (generally not ideal but sometimes happens), understanding the different curves helps estimate how long the slowest-cooling item will take, ensuring everything is properly chilled.
- Equipment Sizing and Selection9: When a business is investing in a vacuum cooler, understanding the cooling curves for their primary products helps select the right capacity machine. A machine that can cool a batch of lettuce in 20 minutes might handle X tons per day, but if it’s mostly broccoli taking 30 minutes, the daily throughput will be different.
- Troubleshooting: If a product suddenly starts taking longer to cool than its typical curve suggests, it could indicate an issue with the vacuum cooler (e.g., a vacuum leak, inefficient condenser) or a change in the product itself (e.g., higher field heat, different packing density).
Here’s how data can inform decisions:
| Data Point from Curve | Implication for Operations | Actionable Insight |
|---|---|---|
| Time to reach target temp. | Set optimal cycle duration | Adjust timer settings, potentially increase daily throughput |
| Steepness of initial slope | Indicates amenability to vacuum cooling | Confirm suitability of vacuum cooling for new products |
| Temperature uniformity (if multi-probed) | Highlights evenness of cooling within the batch | Review loading patterns, airflow within the chamber |
| Deviation from baseline curve | Potential issue with product or equipment | Investigate equipment performance or product condition |
By paying attention to these cooling characteristics, businesses can really fine-tune their post-harvest processes.
Conclusion
Different vegetables have distinct cooling curves due to their unique physical properties. Understanding these curves allows for optimized cooling cycles, ensures better product quality and shelf life, and enhances overall operational efficiency when using technologies like vacuum cooling.
-
Understanding this ratio is crucial for optimizing cooling processes in vegetables, enhancing freshness and shelf life. ↩
-
Exploring this topic can help improve cooling efficiency and quality preservation in fresh produce. ↩
-
This knowledge is vital for maintaining vegetable quality post-harvest and optimizing storage conditions. ↩
-
Understanding this concept can enhance your knowledge of how different vegetables cool, improving storage and freshness. ↩
-
Exploring this topic can provide insights into the cooling characteristics of various vegetables, aiding in better preservation techniques. ↩
-
Learning about these challenges can help in selecting the right cooling methods for different produce, ensuring quality and safety. ↩
-
Explore this resource to learn how optimizing cycle times can enhance efficiency and reduce energy costs in post-harvest processes. ↩
-
This link will provide insights into maintaining product quality and extending shelf life through effective post-harvest techniques. ↩
-
Discover essential factors for selecting the right equipment to ensure optimal performance and efficiency in vacuum cooling operations. ↩
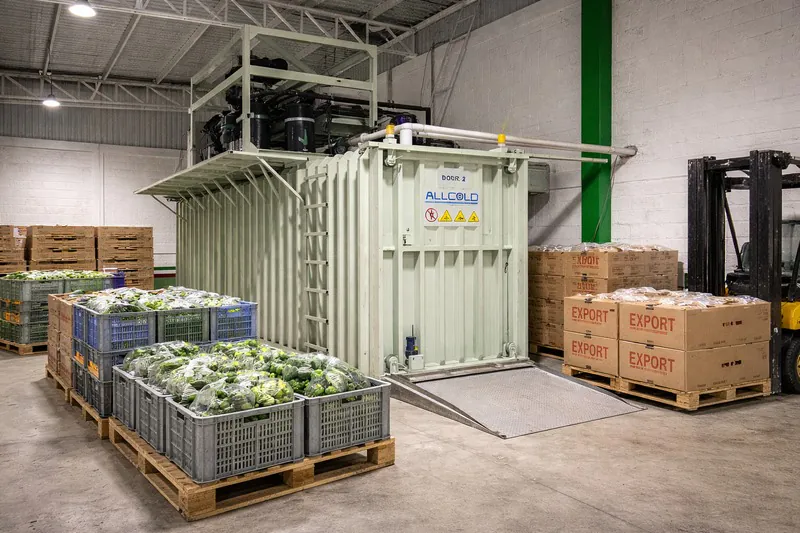
Looking for the right vacuum cooler for your operation?
Allcold engineers work with packhouses and exporters to spec the right system for your product, volume, and site conditions.
Mila
You May Also Like
Vacuum Cooler Not Performing? Check Your Pallet Loading First
When a vacuum cooler produces inconsistent results—warm spots, longer cycle times, variable exit temperatures across the load—the machine is usually
Why One Successful Cooked Rice Cooling Test Is Not Enough to Standardize a Central Kitchen Process
A cooked rice batch can pass a vacuum cooling test and still fail as a production process. That is the
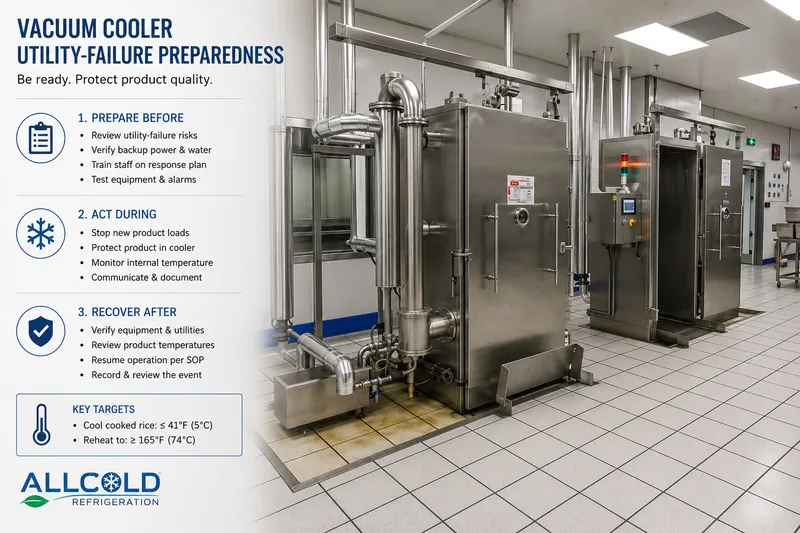
Why a Vacuum Cooler Utility Failure Becomes an Export Quality Problem Before It Becomes a Repair Problem
A vacuum cooler stoppage does not start as a maintenance problem. In a produce export operation, it becomes a quality
Why Asparagus Loses More Export Value in the First Two Hours After Cutting Than in the Entire Cold Chain That Follows
For fresh asparagus exporters, the most expensive quality loss often happens before the product even reaches the main cold chain.
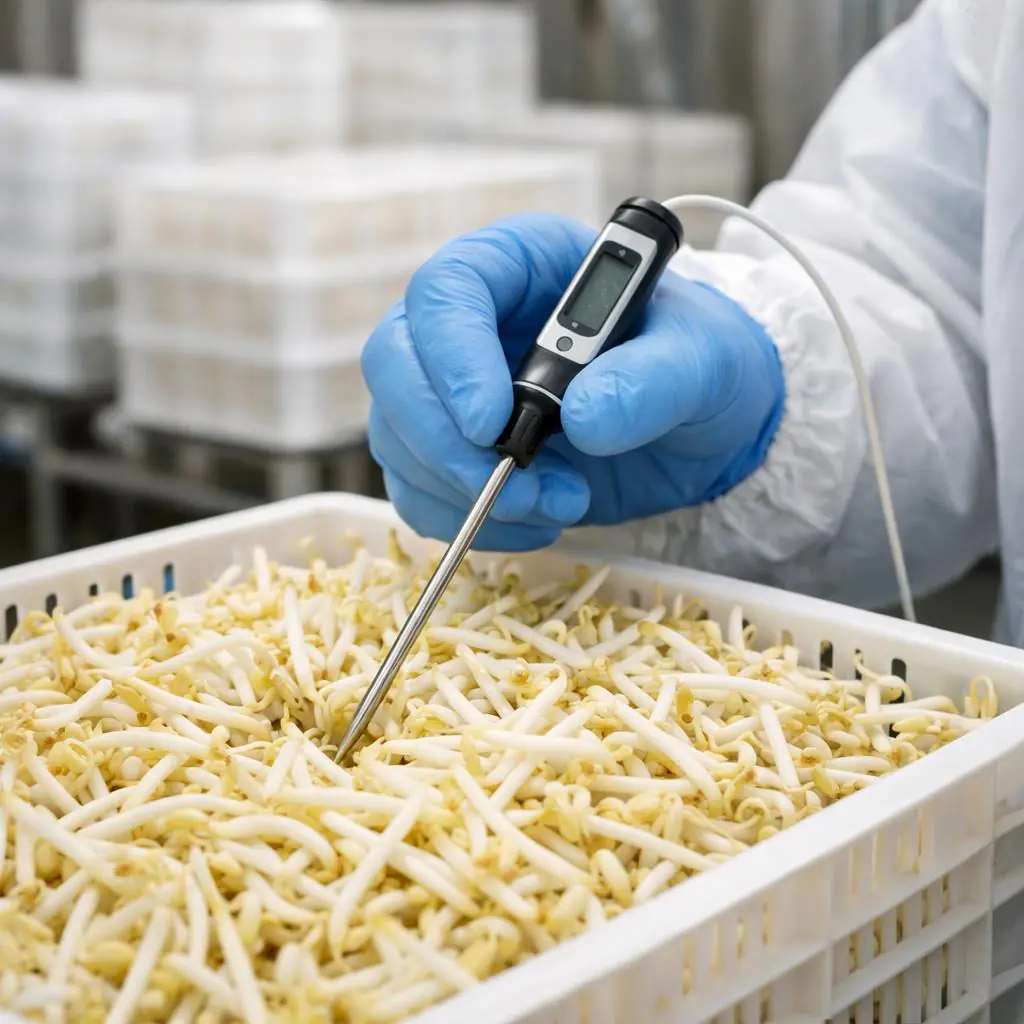
Why Bean Sprouts Are One of the Hardest Vegetables to Pre-Cool Correctly and What Exporters Get Wrong
Bean sprouts look simple. They are light, moist, and usually packed in bulk or retail bags. But from a pre-cooling
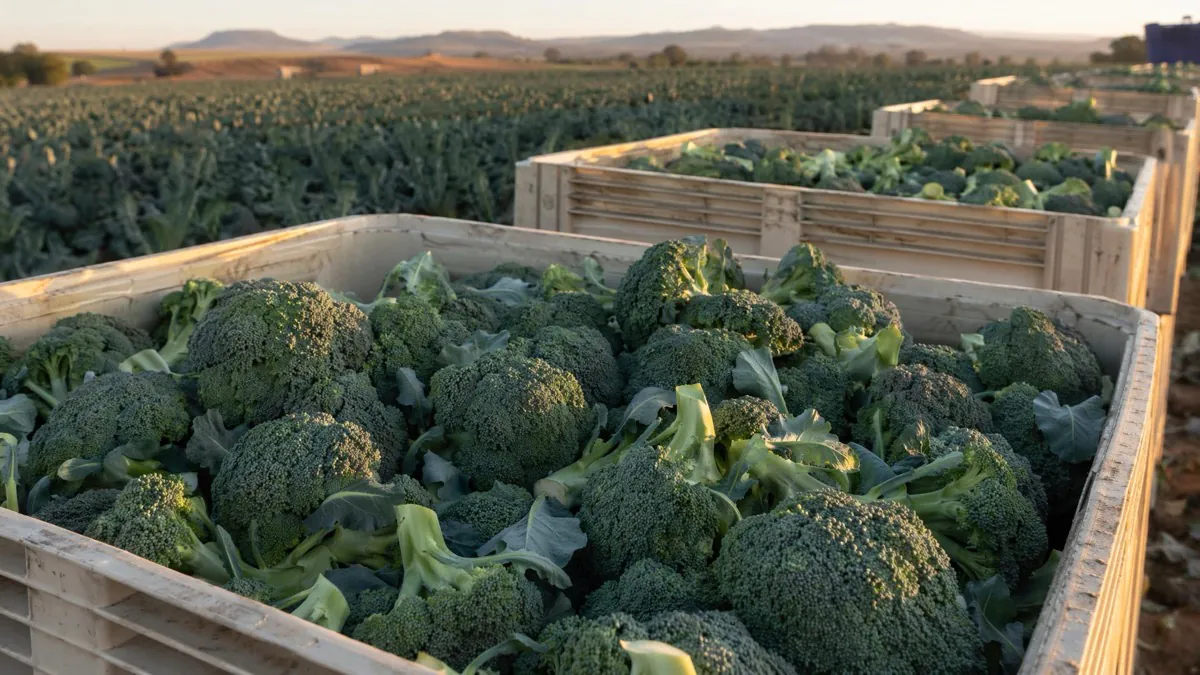
Why Broccoli Loses Export Quality Faster Than Any Temperature Log Will Show
The complaint comes in from the buyer: yellowing, premature flowering, weak texture on arrival. The exporter reviews the cold room
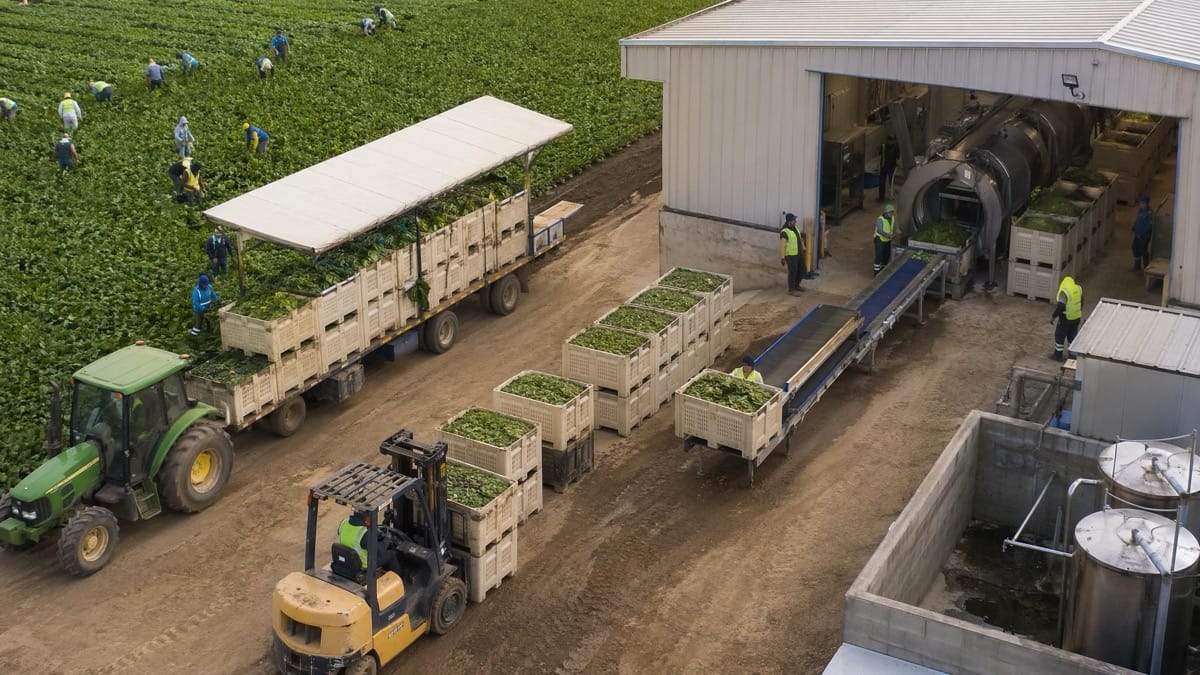
Why Spinach Shipments That Leave Looking Perfect Arrive Looking Wrong
The complaint lands differently with spinach than with most other export vegetables. The exporter packed dark green, crisp product. The
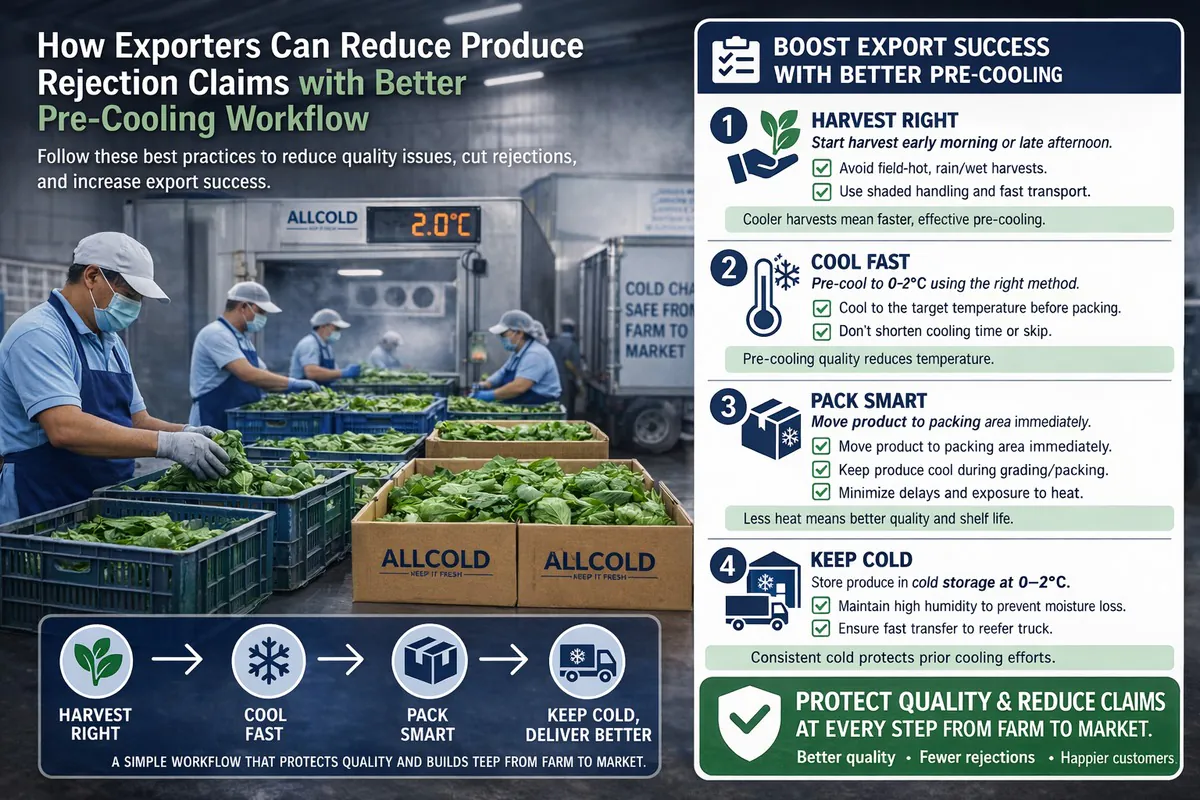
How Exporters Can Reduce Produce Rejection Claims with Better Pre-Cooling Workflow
Learn how exporters can reduce produce rejection claims by improving pre-cooling workflow, timing control, packing handoff, and first-mile cold chain stability.
Buying a Vacuum Cooler for Fresh Produce Export? Avoid These Costly Procurement Mistakes
Buying a vacuum cooler for fresh produce export is not simply a machine purchase. It is a project decision that
How Much Produce Shrink Can Better Pre-Cooling Prevent in Export Projects?
Produce shrink in export projects is not simply a freshness problem. It is a commercial problem that compounds across every