
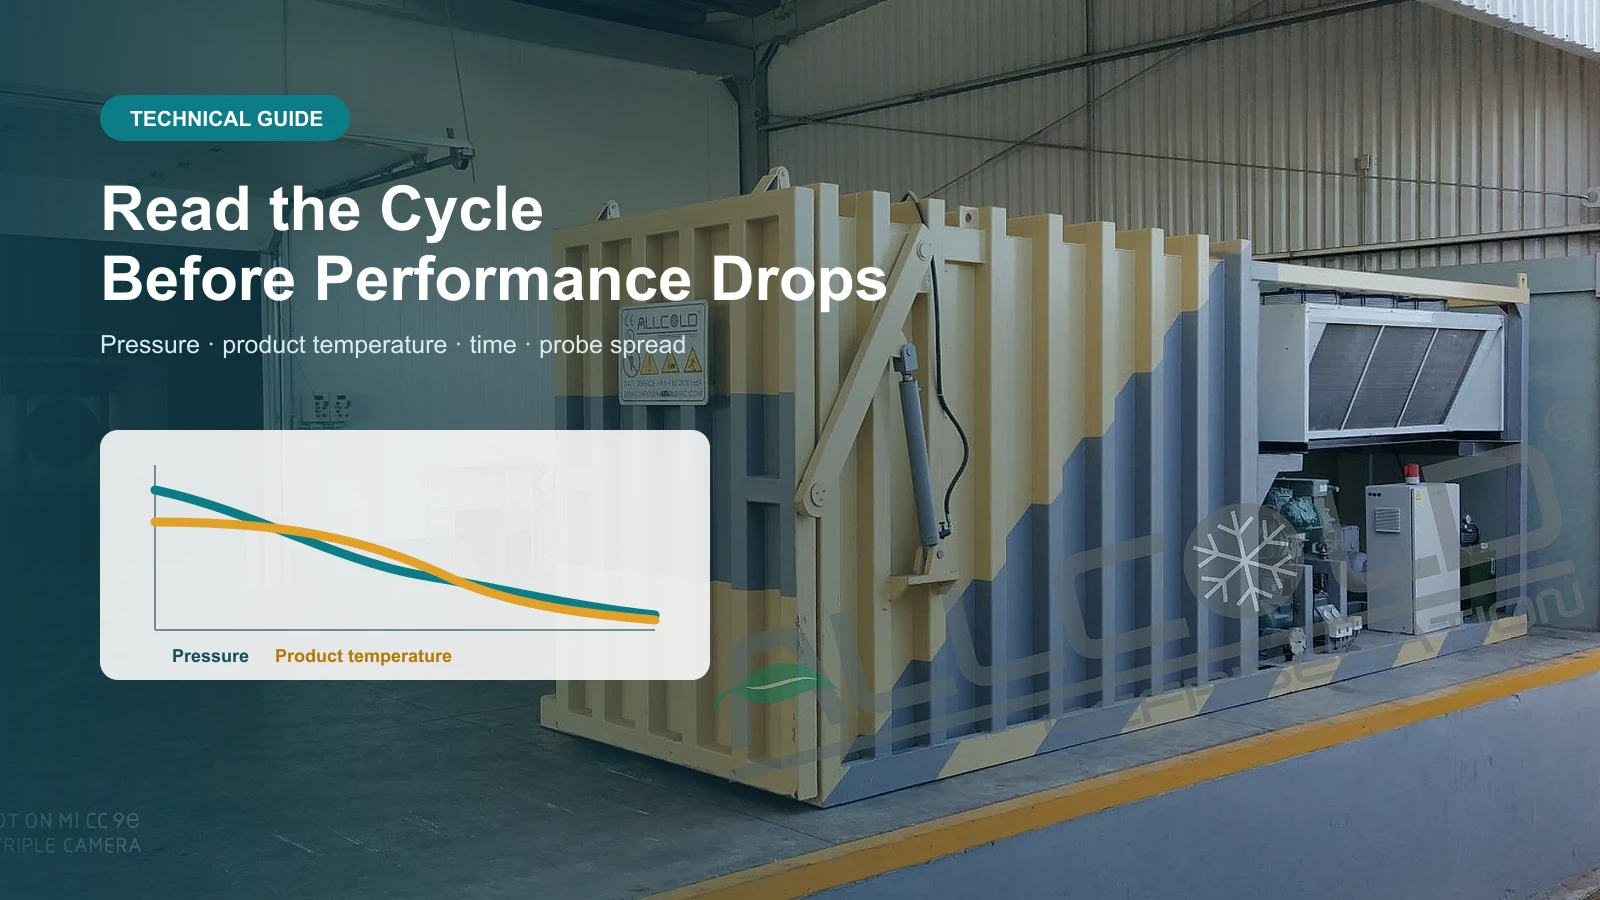
How to Read Vacuum Cooling Cycle Data Before Performance Drops
What is the fastest way to detect declining vacuum-cooler performance?
Do not judge the machine from final pressure or total cycle time alone. Create a repeatable “golden cycle” for each approved product and load format, then compare four points: time to initial evaporation, pressure-versus-temperature tracking during active cooling, time at the target region, and product-temperature spread at release. A change in only one part of the curve can help separate an air leak, changed product load, blocked vapor path, weak refrigeration, or a measurement problem.
A vacuum cooler can still reach its final setpoint while taking longer, consuming more power, or producing a wider temperature spread than it did three months earlier. If the only record says “cycle complete,” that deterioration remains invisible until pallets queue, a shipment arrives warm, or a component trips.
The better approach is to treat every cycle as process data. Pressure tells you what is happening in the chamber. Product probes tell you whether that chamber condition is producing the intended cooling result. Time connects the two. When those signals are reviewed together—and compared only against a truly comparable load—the curve becomes an early-warning tool rather than a decorative HMI screen.
This guide is written for fresh-produce packhouses, food factories, maintenance teams, QA managers, and buyers specifying data functions for a new industrial vacuum cooling system. It explains the diagnostic logic, not a universal alarm recipe. Limits must be established on the actual machine, product, packaging, loading pattern, and approved process.
Final Pressure Is a Result, Not a Diagnosis
Vacuum cooling works because lowering chamber pressure lowers water’s saturation temperature. NIST publishes the underlying pressure-temperature properties of water.[1] In the machine, however, the pressure trace is affected by more than the vacuum pumps. It also reflects chamber volume, leakage, product temperature, exposed moisture, packaging, vapor generation, condenser performance, valve behavior, and the control program.
That is why the same final pressure can hide very different operating conditions:
- A small air leak may make the initial pull-down slower, yet the machine eventually reaches the setpoint.
- A wetter or hotter load may pull down normally at first, then create a longer pressure plateau when evaporation intensifies.
- A refrigeration-side limitation may become visible only after vapor generation rises.
- A probe placed in an outer carton may reach target while the slowest product position remains warm.
A good record therefore keeps pressure, product temperature, elapsed time, recipe, batch identity, and load description together. Siemens documentation describes trend views as a way to display multiple process values continuously and process-value logging as a basis for later graphical or spreadsheet evaluation.[2] The exact data storage and export functions depend on how the HMI and PLC are configured, so buyers should confirm them before ordering rather than assuming every panel archives the same information.
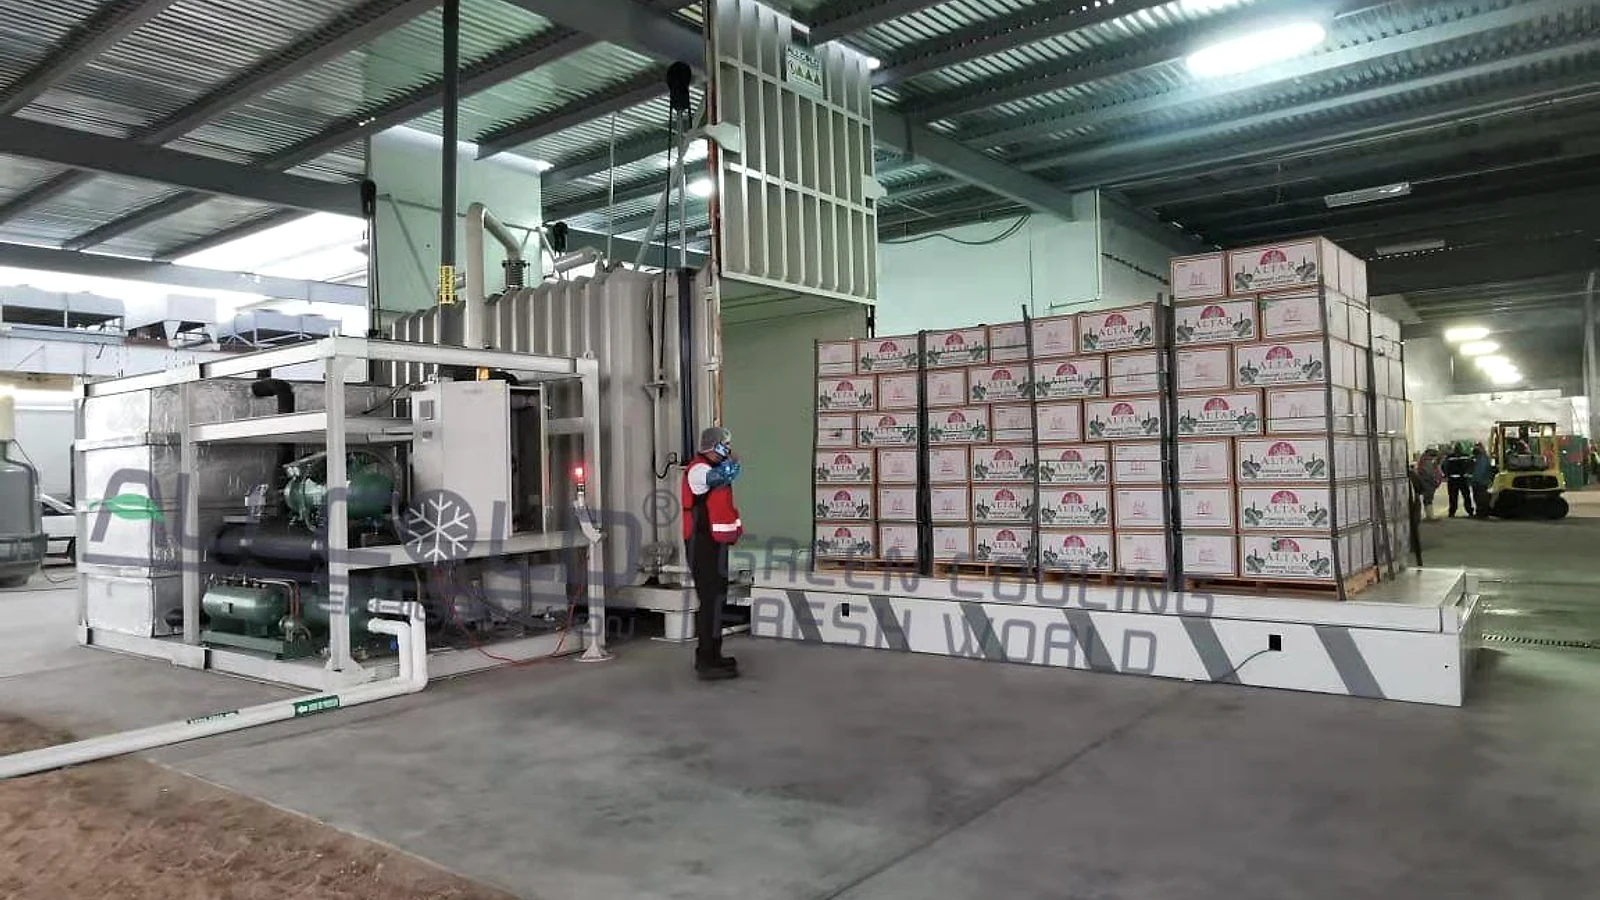
Read the Cycle in Four Diagnostic Zones
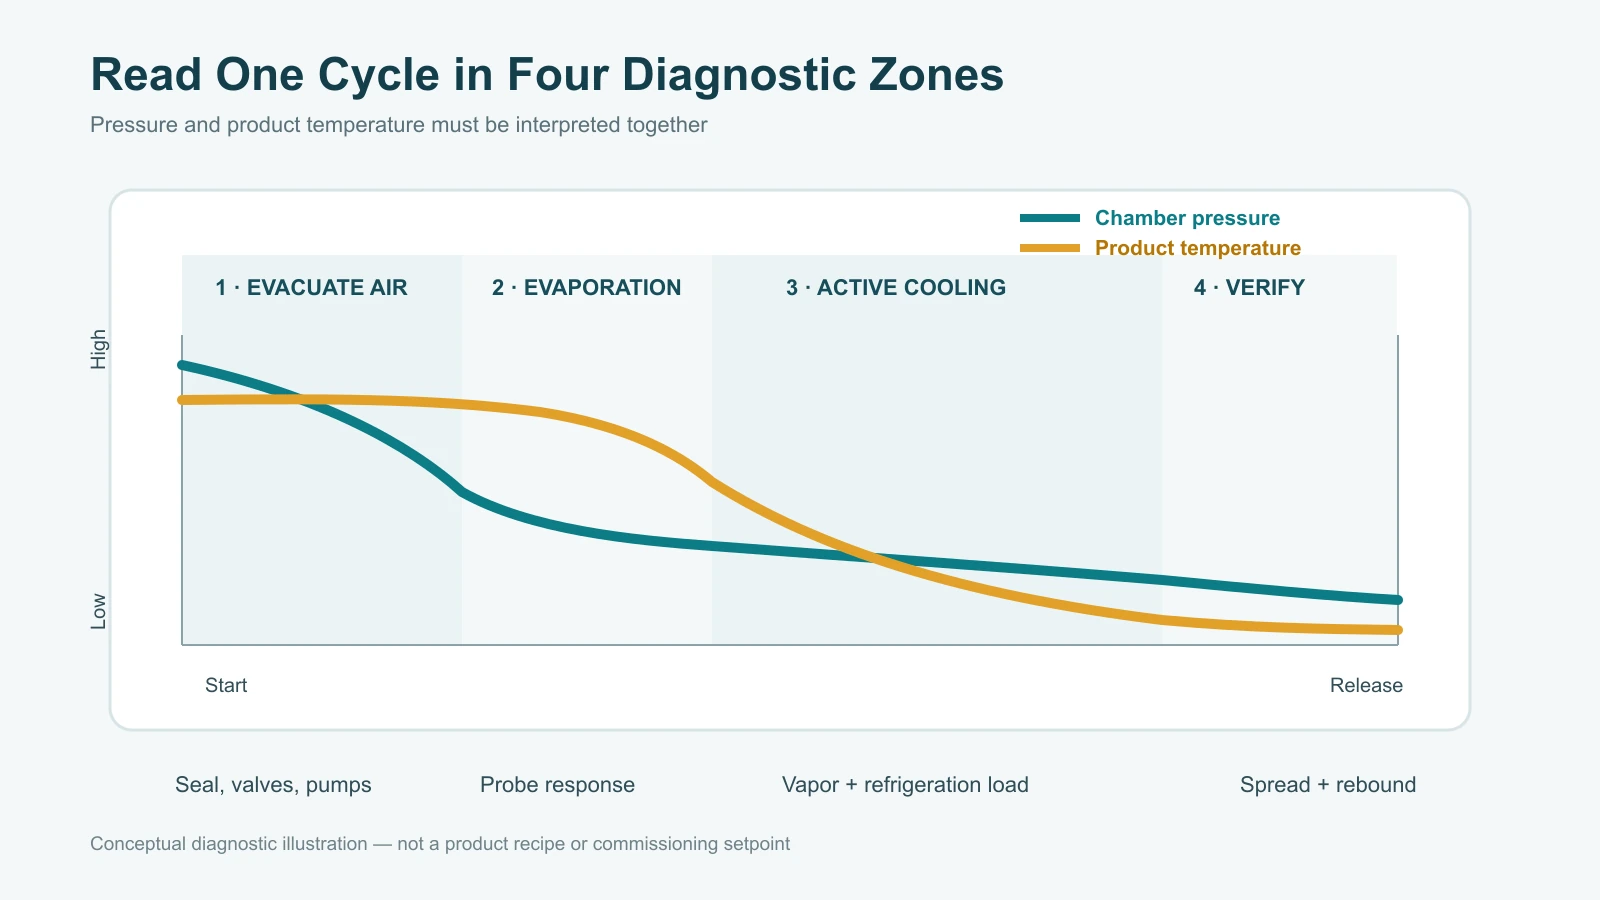
Instead of treating the graph as one long line, divide it into four operational zones. The exact pressure and time boundaries vary by application; the diagnostic questions remain consistent.
Zone 1: Bulk-Air Evacuation
Early in the cycle, the pumps are mainly removing non-condensable air. Product temperature usually changes little. This zone is especially useful for checking vacuum integrity because the product has not yet become the dominant vapor source.
If Zone 1 becomes consistently slower with the same chamber, door condition, recipe, and load format, inspect simple causes first: door-seal contamination or damage, incomplete door closure, valve position, leaking connections, pump condition, or a change in the actual free chamber volume. An empty-chamber test can help isolate the equipment, but it cannot prove loaded cooling capacity.
Zone 2: Evaporation Onset
As chamber pressure approaches the saturation pressure associated with product temperature, evaporation becomes active and the product-temperature trace should begin to respond. The relationship will not be perfectly identical in every batch, but a stable process should show a repeatable transition region.
If pressure falls but the measured product temperature does not respond as expected, check probe position and contact before changing the recipe. Also review whether packaging vents, liners, stretch wrap, carton orientation, or product surface condition changed. The machine can create the correct chamber pressure while the measured product fails to exchange moisture effectively.
Zone 3: Active Cooling and Vapor Handling
This is where the load releases the most water vapor and where the refrigeration trap, vapor path, vacuum system, and control logic must work together. A controlled pressure plateau can be normal: the system is removing newly generated vapor while product temperature falls.
The diagnostic question is not “is there a plateau?” but “is this plateau repeatable for this product and load?” A longer or higher plateau may come from a hotter load, extra surface water, greater batch mass, a different crop or recipe, ice or contamination on a vapor-side surface, changed cooling-water or ambient conditions, or reduced refrigeration performance. Do not diagnose a pump fault from the plateau alone.
Zone 4: End Point and Release Verification
At the end of the cycle, verify the slowest representative product temperature, temperature spread between probes, time spent near the target region, and any post-release rebound. A single fast probe should not release a mixed or poorly mapped load.
USDA Agriculture Handbook 66 treats precooling, storage requirements, packaging, chilling sensitivity, and commodity-specific behavior as separate but connected postharvest factors.[3] That supports an important operating rule: do not compare the curve for one commodity or package format against another and call the difference machine deterioration.
Build a “Golden Cycle” That Is Actually Comparable
A golden cycle is not the fastest cycle ever recorded. It is a verified, repeatable reference run produced under documented conditions, with acceptable temperature uniformity and product quality. One reference is rarely enough. A packhouse handling lettuce, mushrooms, herbs, and broccoli may need a separate baseline for each approved combination of product, pack, and load.
Record at least:
- machine ID and recipe/program version;
- date, operator, start time, and ambient or relevant utility condition;
- product, variety where important, harvest or production lot, and initial temperature range;
- carton, crate, liner, vent pattern, wrap level, pallet height, and pallet positions;
- actual batch mass and whether the chamber is full or partial;
- probe identification and exact placement, including the expected slow point;
- time-stamped pressure and product-temperature data;
- time to defined landmarks, final temperature spread, and rebound check;
- quality observations and the final disposition of the batch.
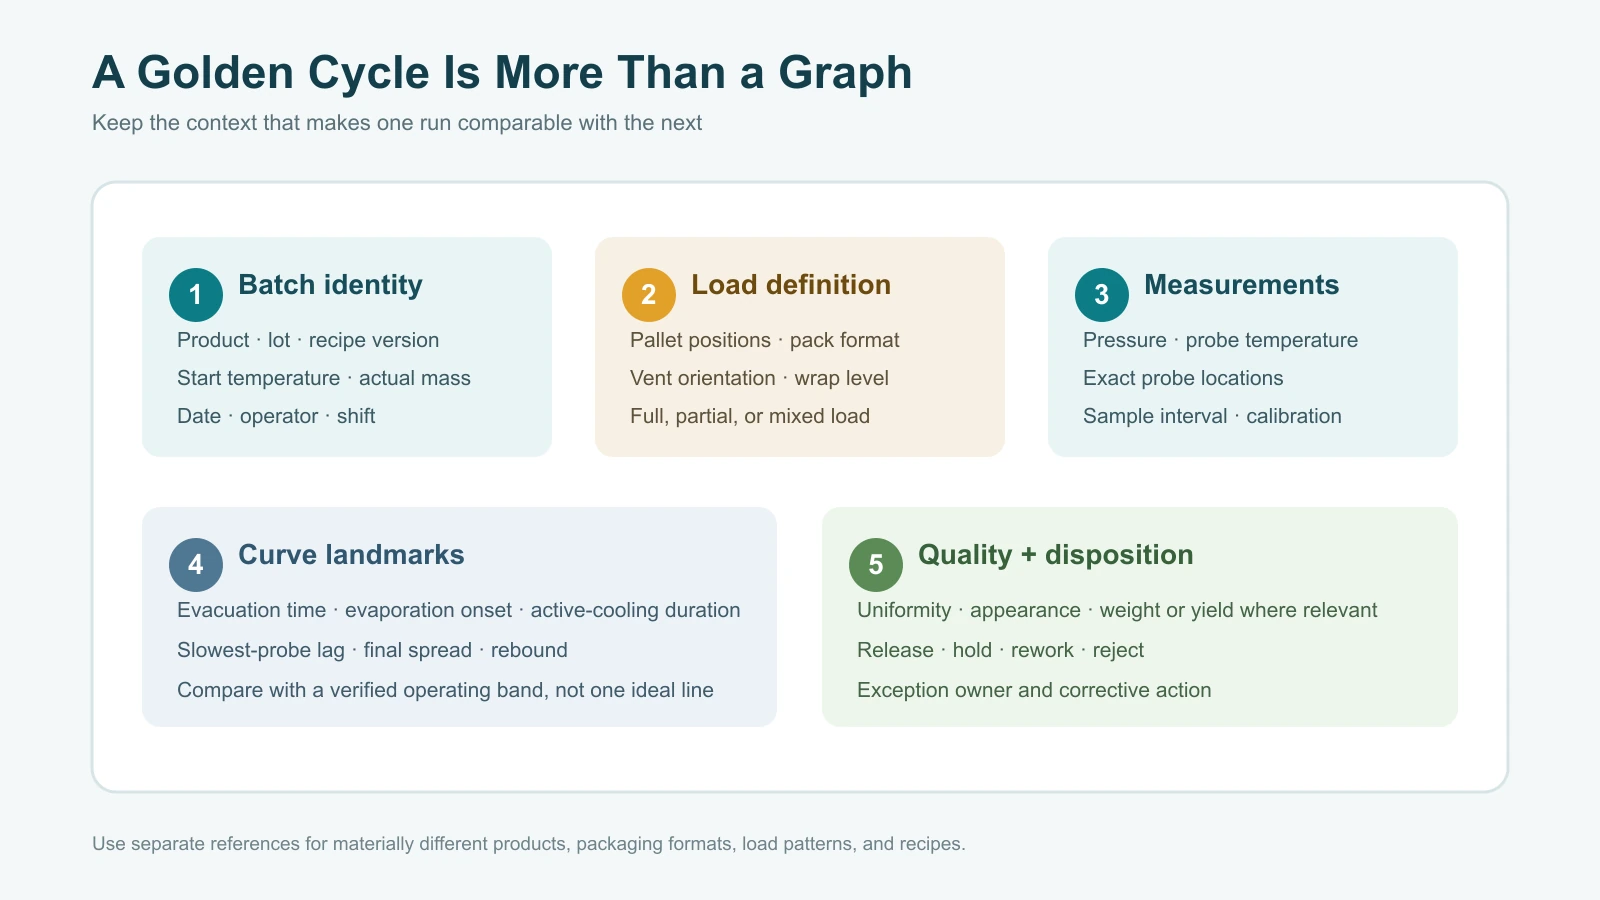
Run several acceptable batches before fixing a reference band. Natural produce variation means one line should not become an unrealistic tolerance. Use a normal operating envelope, then investigate changes that persist across comparable loads or move beyond the approved boundary.
Five Curve Changes and What They Suggest
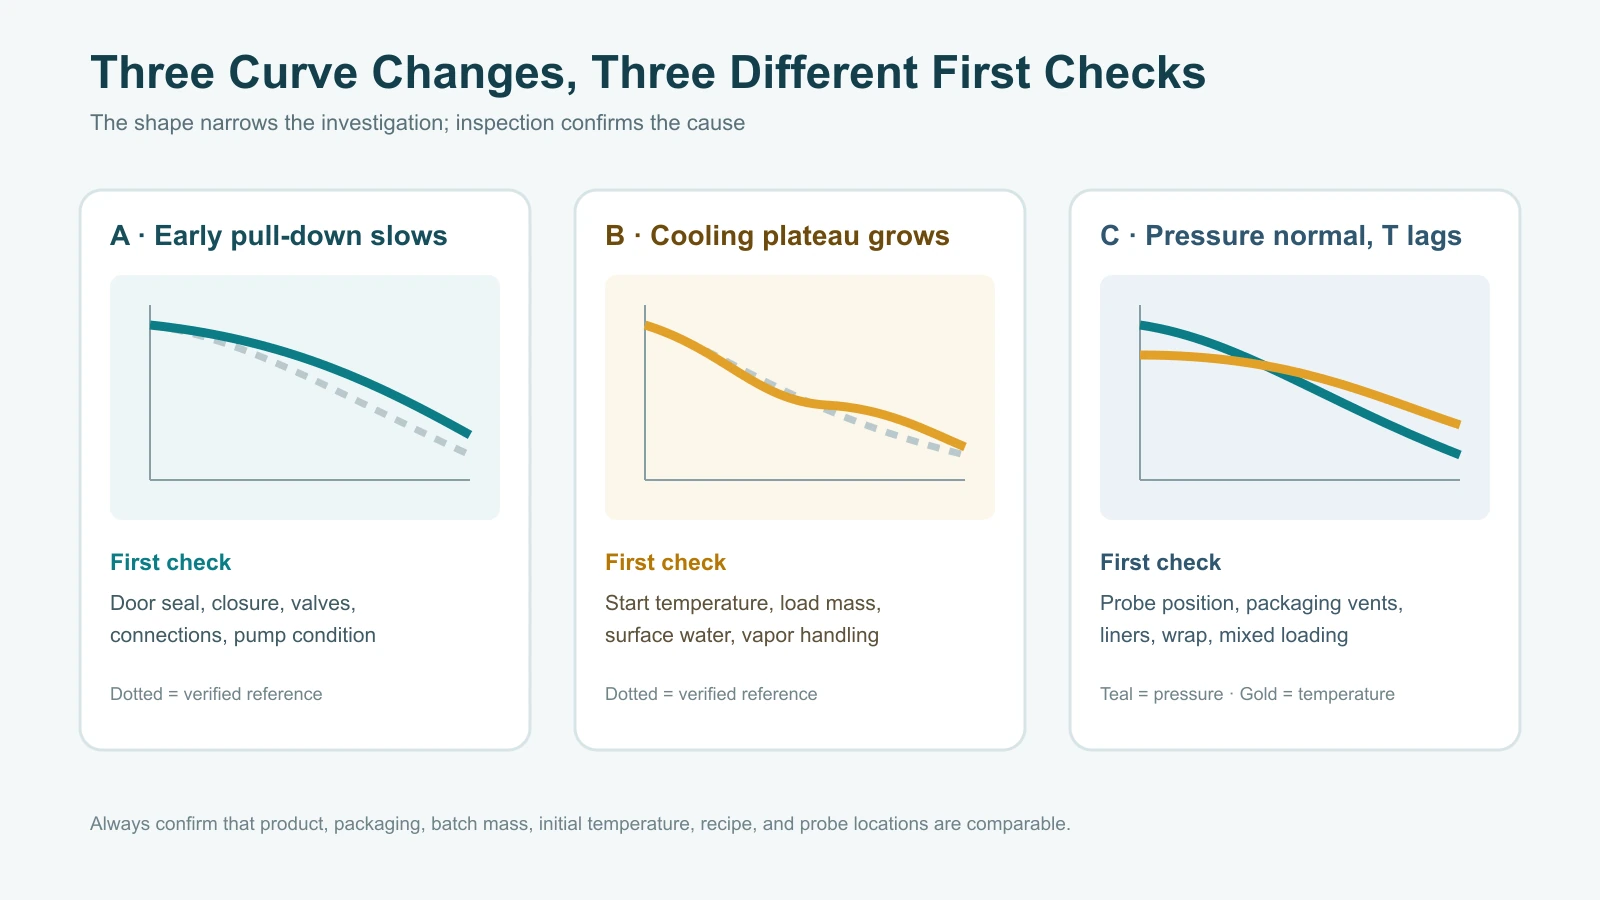
Curve signatures narrow the search; they do not replace inspection. The following matrix is a practical triage guide.
| Observed change | First interpretation | Checks before changing settings |
|---|---|---|
| Zone 1 slower; later zones broadly normal | Air removal or vacuum-integrity issue is more likely than a product issue | Door seal, closure, valves, pipe joints, pump oil/condition, free chamber volume |
| Zone 1 normal; active-cooling plateau longer | Vapor load or vapor-handling/refrigeration condition changed | Start temperature, batch mass, surface water, crop/recipe, condenser/trap condition, cooling water or ambient |
| Pressure normal; product temperature falls slowly | Product access, packaging, probe, or load definition may be wrong | Probe placement/calibration, liners, vents, wrap, carton orientation, mixed load, product suitability |
| Fast probe reaches target; spread is wider | Sampling or load uniformity problem | Slow-point mapping, probe count, pallet positions, mixed product, initial-temperature range |
| All stages shift after service or program edit | Configuration or instrumentation change may be driving the difference | Recipe revision, sensor replacement/calibration, valve timing, VFD parameters, clock/sample interval |
Use an Empty-Chamber Test Carefully
An empty test is useful for establishing equipment-side pump-down behavior with minimal product vapor. It can help identify a large leak, valve problem, or change in pump performance. But it does not challenge the condenser and vapor-handling system the way a hot, wet load does, and it proves nothing about product-temperature uniformity.
Keep two different references:
- Equipment reference: an approved empty or defined dummy-load procedure performed under consistent conditions.
- Process reference: a loaded golden cycle for each commercially important product and pack format.
If the equipment reference shifts, maintenance should investigate the machine. If only one loaded reference shifts, start with that product, packaging, initial condition, and loading method. If every loaded reference shifts while the empty test remains stable, review vapor handling and utilities under load before blaming the primary vacuum stage.
Trend Landmarks, Not Just Total Minutes
Total cycle time is easy to report but weak for diagnosis. A better dashboard uses a small set of landmarks:
- time from start to the defined end of bulk-air evacuation;
- time to first sustained product-temperature response;
- duration of the active-cooling region;
- time from first probe at target to slowest probe at target;
- temperature spread at release;
- temperature rebound after a defined interval;
- cycles since cleaning, seal inspection, oil service, or other relevant maintenance.
A run chart of these landmarks makes gradual drift easier to see. Do not set alarm limits from a handful of convenient batches. First confirm the measurement system, collect enough comparable data, document normal product variation, and decide who reviews exceptions. If electronic records form part of a food-safety or quality program, the site should also define access, retention, review, and corrective-action responsibilities rather than treating exports as informal screenshots.
Separate Process Alarms from Maintenance Alarms
A quality team and a maintenance team look at the same cycle for different reasons. Build the response accordingly.
| Alarm purpose | Typical trigger | Immediate question |
|---|---|---|
| Product release | Slowest probe or temperature spread outside approved limit | Can this lot be released, reprocessed, held, or must it be rejected? |
| Process discipline | Wrong recipe, unknown load, missing probe, or undocumented packaging change | Is the cycle comparable to an approved process at all? |
| Maintenance warning | Landmark time drifts across several comparable cycles | Which zone changed, and what equipment serves that zone? |
This division prevents a common mistake: maintenance makes a setting change to improve cycle time while QA has not confirmed that the adjusted process still protects the product. The approved recipe is a controlled process document, not a shortcut around a dirty seal, changed pack, or overloaded chamber.
What to Specify When Buying a New System
When comparing industrial vacuum cooling systems, ask beyond pump size and chamber capacity. A useful data specification should state:
- which pressure, temperature, alarm, recipe, and cycle-status tags are recorded;
- sample interval and whether fast events can be resolved;
- local storage capacity, export format, time synchronization, and batch identification;
- whether operators can overwrite recipes and how revisions are logged;
- how many product probes are supported and how calibration is documented;
- whether trend data remain available after power loss or HMI replacement;
- who owns configuration, backup, restore, and cybersecurity responsibilities.
These items belong in a detailed proposal alongside the application, chamber, refrigeration, vacuum, controls, utilities, and acceptance scope. Allcold’s guide to reducing project risk through clearer quotations explains why responsibility boundaries should be visible before an order is placed.
A Practical Weekly Review
For each high-volume product, select a small number of representative cycles and review them against the current golden-cycle band. Exclude or separately label loads that were partial, mixed, unusually hot, packaged differently, or run during known service work. Then ask:
- Did the early pump-down zone move?
- Did evaporation begin at a comparable point?
- Did the active-cooling plateau become longer or less stable?
- Did the slowest probe lag further behind?
- Did final spread or rebound change?
- Was there an operational change that explains it?
If the answer is unexplained and repeats across comparable cycles, create a maintenance work order before the drift becomes downtime. For immediate failures, use a safe troubleshooting sequence and qualified technicians; the site’s existing vacuum-cooler troubleshooting guide remains the better starting point.
The Most Valuable Graph Is the One You Can Explain
A sophisticated trend screen does not create process control by itself. The value comes from defining comparable loads, placing probes consistently, storing enough context, reviewing the same landmarks, and connecting each exception to a documented response.
Before requesting a recommendation from Allcold, send the product, batch mass, loading format, start and target temperatures, packaging details, peak throughput, site utilities, and the data or reporting functions your team requires. That lets the engineering discussion connect cooling capacity to the way your operation will verify it. You can send those details through the vacuum cooling project assessment form.
References
- National Institute of Standards and Technology (NIST), Thermophysical Properties of Fluid Systems, including saturation properties for water.
- Siemens Industry Support, Logging Process Values with WinCC (TIA Portal), trend display and spreadsheet evaluation guidance.
- U.S. Department of Agriculture, Agricultural Research Service, The Commercial Storage of Fruits, Vegetables, and Florist and Nursery Stocks, Agriculture Handbook 66, 2016.

Mila
You May Also Like
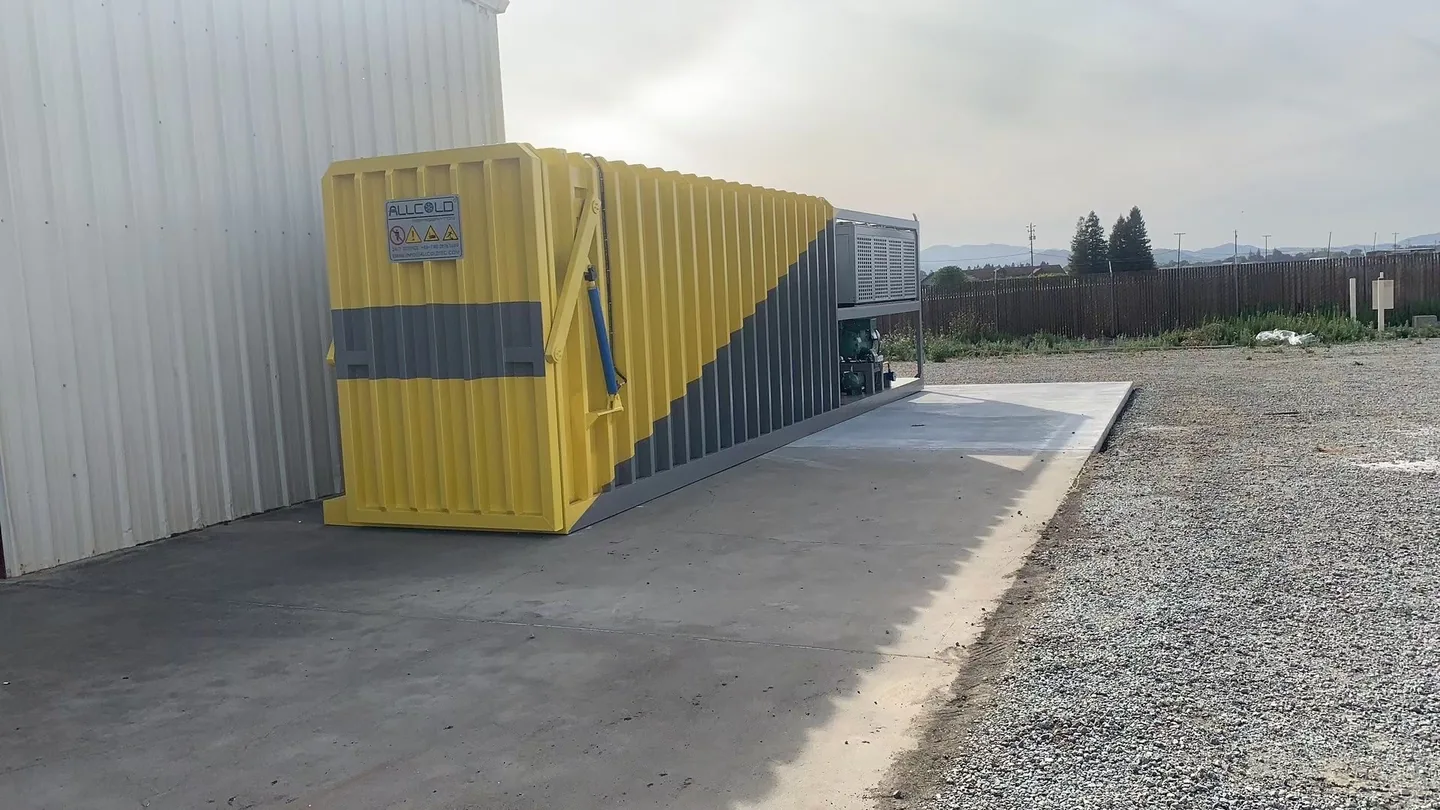
Can Your Floor Support a Vacuum Cooler? Look Beyond Tonnes per Square Metre
Check vacuum cooler floor loading before you buy: operating weight, support reactions, forklift wheel loads, ramps and the site data your engineer needs.
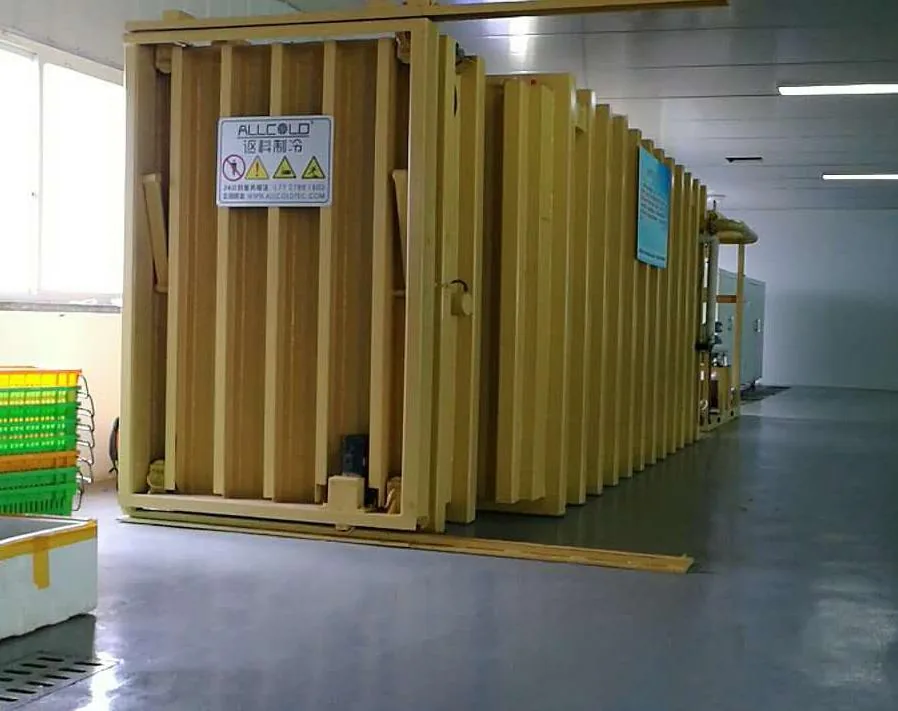
Buying a Vacuum Cooler Near the Coast? Specify More Than Paint
Coastal protection is more than chamber paint. Use this component-by-component checklist to compare vacuum cooler quotations, test evidence and maintenance scope.
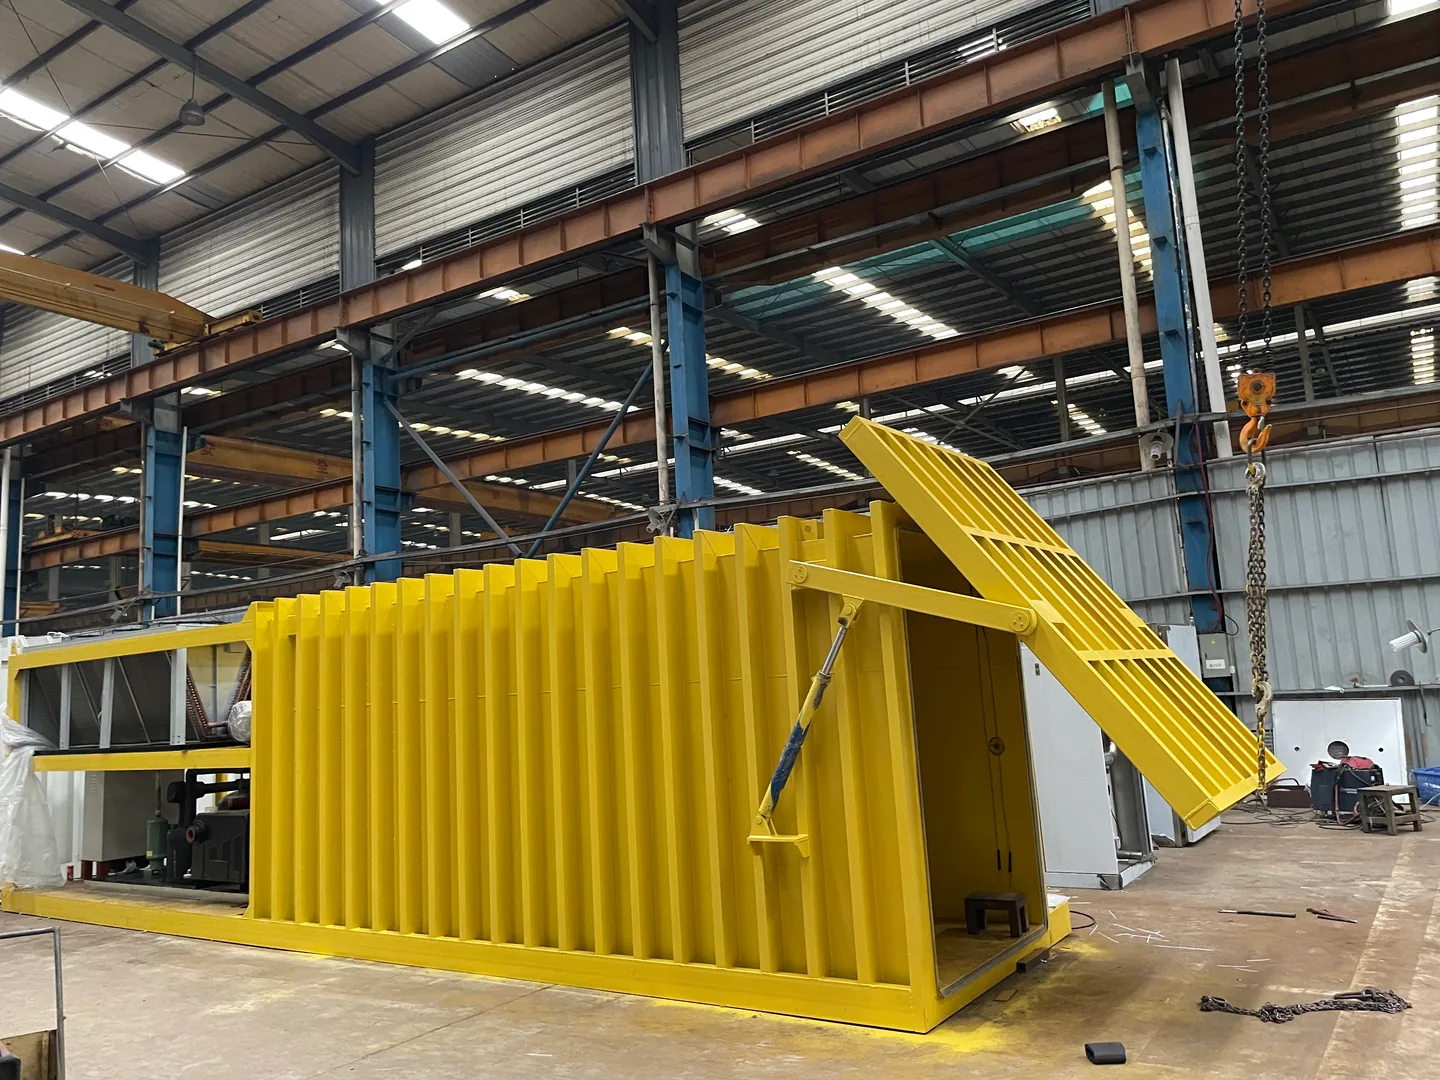
50 Hz or 60 Hz? How to Confirm a Vacuum Cooler Will Work at Your Site
Buying a vacuum cooler for 50 Hz or 60 Hz power? Check whole-machine compatibility, auxiliaries, conversion scope and quoted performance before ordering.
Can You Move a Vacuum Cooler Between Farms for Different Harvest Seasons?
ALLCOLD · MULTI-SITE COOLING & EQUIPMENT PLANNING Sharing one cooler across two growing regions can look efficient on an annual
How Loud Is a Vacuum Cooler? Plan for Noise Before You Buy
ALLCOLD · EQUIPMENT SELECTION & SITE PLANNING A cooler can fit the available space and still be in the wrong
Air-Cooled, Water-Cooled or Evaporative: Which Vacuum Cooler Fits Your Site?
VACUUM COOLER BUYER’S GUIDE · SITE UTILITIES Three heat-rejection arrangements can mean very different utilities, maintenance and installed costs. Compare
Vacuum Cooling vs. Vacuum Packaging: Which Machine Do You Need?
ALLCOLD · EQUIPMENT SELECTION Two machines can both use a vacuum chamber and still solve completely different production problems. Before
Should You Buy a Vacuum Cooler or Use a Third-Party Cooling Service?
FARM INVESTMENT · OWNERSHIP VS. OUTSOURCING The cooling fee is easy to see. The cost of getting your harvest cooled
Can a Vacuum Cooler Work at High Altitude? A Buyer’s Guide for Farms
Buying a vacuum cooler for a high-altitude farm? Learn how altitude affects pressure readings, equipment selection and the site details your supplier needs.
Where Should Two Product Temperature Probes Go in a Vacuum Cooler?
Learn how to place a vacuum cooler’s two standard product temperature probes, avoid false cold readings and define repeatable production locations.